Posted by Matt Peters
At Moz, we have been following up on our 2013 Search Engine Ranking Factors study by continuing to analyze interesting aspects of the data. One of our most frequently asked questions is, “Do you see any systematic differences in Google’s search results across search volume or topic category?” By design, our main study used a broad keyword set across all search volumes and industries to capture Google’s overall search algorithm. As a result, we weren’t able to answer this question since it requires segmenting the data into different buckets. In this post, I’ll do just that and dig into the data in an attempt to answer this question.
Our approach
We used a subset of the data from our 2013 Ranking Factors study, focusing on a few of the most important factors. In the main study, we collected the top 50 search results for about 15,000 keywords from Google, along with more then 100 different factors. These included links, anchor text, on-page factors, and social signals, among others. Then, for each factor we computed the mean Spearman correlation between the factor and search position. Here’s a great graphic from Rand that helps illustrate how to interpret the correlations:

In general, a higher correlation means that the factor is more closely related to a higher ranking than a lower correlation. It doesn’t necessarily mean that there is causation!
In addition to search results and factors, we collected the categories from AdWords (e.g. “Home and Garden”) and the monthly US (local) search volume. This allows us to examine correlations across these different segments.
Search volume
First up is search volume. We segmented each keyword into one of three buckets depending on the average local (US) monthly search volume from AdWords: less than 5,000 searches per month, 5,000-15,000 searches per month, and more than 15,000 searches per month.
To begin exploring the data, here is the median page and domain authority in each bucket, along with the total percentage of results with a domain name exactly matching the keyword:

Not too surprisingly, we see the overall page authority, domain authority and the exact match domain (EMD) percentage all increase with search volume. This is presumably because higher-volume queries are targeted by larger, more authoritative sites.
Now, an overall higher page authority for high-volume queries doesn’t necessarily mean that the correlation with search position will be larger. The correlation measures the extent to which page authority (or any other factor) can predict the ordering. As a example, consider two three-result SERPs, one with page authorities of 90, 92, and 88 for the first three positions; and another with values of 30, 20, and 10. The first SERP has higher values overall, but a lower correlation. To examine how these impact search ordering, we can compute the mean Spearman correlation in each bucket:

And for those who prefer a chart:

From left to right, the table lists link-related factors (page authority, domain authority, and exact match anchor text); a brand-related factor (number of domain mentions in the last 30 days from Fresh Web Explorer); social factors (number of Google +1s, Facebook shares, and tweets); and keyword-related factors (keyword usage on the page, in the title, and EMD).
Looking at the data, we can see a few interesting things:
- The correlations increase noticeably with search volume for link, brand, and social media factors.
- The correlations are mostly constant for keyword-related factors (keyword usage on the page or in the domain name).
Primarily, point #1 says that these factors do a better job at predicting rank as search volume increases. We’d expect to see a larger discrepancy in the link or social metrics throughout the SERPs in higher volume queries than in lower-volume queries. One corollary is that SERPs from lower-volume queries are more heavily influenced by factors that aren’t represented in the table (e.g. positive or negative user signals).
One implication of point #2 is that Google’s keyword-document relevance algorithm is the same for high- and low-volume queries. That is, their method for determining what a page is about doesn’t depend the query popularity.
We can make this more concrete by considering two different queries and SERPs: one high volume (“cheap flights” with more than 1 million searches per month), and one low-volume (“home goods online” with less than 500 searches per month). For reference, here are the top results for each search, with the page and domain authority from the MozBar:

Above: Google SERP for “cheap flights”

Above: Google SERP for “home goods online”
When a user enters a query, Google first determines which of the many pages in its index are relevant to the query, then ranks the results. A popular query will likely have several relevant pages (or more) with many links, since they are targeted by marketers. In this case, Google should have plenty of signals to determine ranking. A relevant page with high page authority? Check, put it in the top 10. On the other hand, pages in the dark corners of the internet with relatively few links are likely most relevant to low-volume queries. In the low-volume case, since the link signals aren’t as clear, Google is forced to rely more heavily on other signals to determine ranking, and the correlations decrease. This example oversimplifies the complexity of the algorithm, but provides some intuitive understanding of the data.
Site category
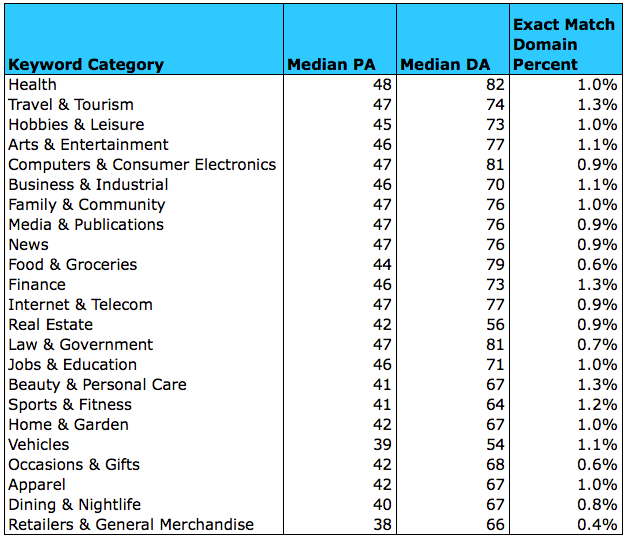
We can repeat the analysis for the different AdWords categories. First, the median page and domain authority and EMD percentage:
And the mean Spearman correlations:
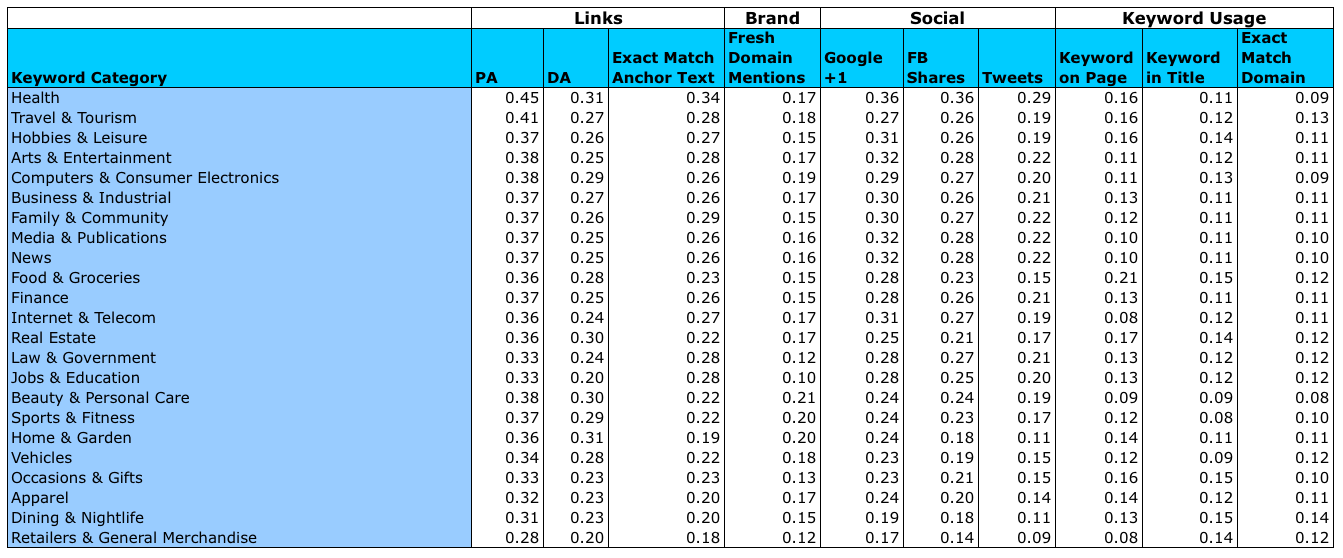
Overall, the trends are similar to search volume, with significant differences in the link correlations, and smaller differences in the keyword-related correlations. The explanation for these results is similar to the one above for search volume. The industries with the largest link and social correlations — “Health” and “Travel & Tourism” — tend to have broad-based queries targeted by lots of sites. On the other hand, the industries near the bottom of the table — “Apparel,” “Dining & Nightlife,” and “Retailers & General Merchandise” — all tend to have specific or local intent queries that are likely to be relevant to specific product pages or smaller sites.
Takeaways
In this post, we have explored how a few individual ranking factors vary across search volume and keyword category. Correlations of link- and social-related metrics increase with search volume, but correlations of keyword-related factors (usage on page and in the domain name) are constant across search volume. Taken together, this suggests that Google is using the same query document relevance algorithm for both head and tail queries, but that link metrics predict SERPs from popular queries better then tail queries. We see something similar across site categories with the largest differences in link related correlations. Industries like “Health” that have broad, informational queries have higher correlations than industries like “Apparel” that tend to have queries with specific product intent.
Sign up for The Moz Top 10, a semimonthly mailer updating you on the top ten hottest pieces of SEO news, tips, and rad links uncovered by the Moz team. Think of it as your exclusive digest of stuff you don’t have time to hunt down but want to read!